Case Study: Mill vs sbt
This page goes into the weeds comparing the Mill and SBT build tools. For a higher-level comparison of Mill vs other tools, and why Mill is interesting, see the page Why Use Mill?.
Compared to sbt,
-
Mill makes customizing the build yourself much easier: most of what build tools do work with files and call subprocesses, and Mill makes doing that yourself easy. This means you can always make your Mill build do exactly what you want, and are not beholden to third-party plugins that may not meet your exact needs or interact well with each other.
-
Mill is much more performant:
sbthas enough overhead that even a dozen subprojects is enough to slow it down, while Mill can handle hundreds of modules without issue. Custom tasks insbtre-execute every time, whereas in Mill they are cached automatically. Mill’s watch-for-changes-and-re-run implementation has much lower latency thansbt's. The list of ways Mill improves uponsbt's performance is long, and at the command line you can really feel it -
Mill builds are much easier to understand: Your Mill build is made of bog-standard
objects anddefs, rather thansbt's four-dimensional task matrix. Your IDE’s "jump-to-definition" in Mill actually brings you to the implementation of a task, rather than ansbttaskKeydeclaration. Customizing things is as simple as writing or overridingdefs. The net effect is that despite both tools' build files being written in Scala, Mill’s build files are much easier to understand and maintain.
This page compares using Mill to sbt, using the Gatling Load Testing Framework codebase as the example.
Gatling is a medium-sized codebase, 40,000 lines of Scala split over 21 subprojects.
By porting it to Mill, this case study should give you an idea of how Mill compares to sbt in more realistic, real-world projects.
In general, in the ideal case Mill and sbt have similar performance: caching, parallelism, incremental
compilation, and so on.
Mill’s main advantage over sbt is its simplicity:
-
You do not need to keep a live
sbtsession to maximize performance, exitsbtto run Bash commands, or juggle multiple terminal windows to runsbtin one and Bash in another. Instead, you can just run Mill like any command line tool, and Mill caches and parallelizes to maximize performance automatically -
Mill’s IDE support is better than
sbt's due to how Mill is designed: peek-at-documentation, jump-to-definition, find-overrides, etc. is much more useful since your IDE understands Mill much better than it understandssbt. -
Mill comes with a lot of useful debugging tools builtin, without needing to juggle external plugins: visualizing subproject dependencies, performance profiles, third-party dependency trees. This helps you understand what your Mill build is doing.
To do this comparison, we have written a Mill build.mill file for the Gatling project. This can be used
with Mill to build and test the various submodules of the Gatling project without needing to
change any other files in the repository:
Completeness
The Mill build for Gatling is not 100% complete, but it covers most of the major parts of Gatling: compiling Scala, running tests. It does not currently cover linting via Spotless, as that is not built-in to Mill, but it could be added as necessary.
The goal of this exercise is not to be 100% feature complete enough to replace the sbt build
today. It is instead meant to provide a realistic comparison of how using Mill in a realistic,
real-world project compares to using sbt.
Performance
| Benchmark | Cold sbt |
Hot sbt (rounded) |
Mill |
|---|---|---|---|
34.28s |
≈ 14s |
10.4s |
|
10.1s |
≈ 1s |
0.96s |
|
6.2s |
≈ 0s |
0.48s |
|
4.2s |
≈ 0s |
0.40s |
sbt can be used in two modes, either "cold" run directly from the command line, or "hot"
where an sbt session is kept open and commands are run within in. I provide the timings for
both scenarios above, along with the time taken for Mill commands. Mill does not have this
distinction, and can only be run directly from the command line. The Hot sbt mode only
reports timings to the nearest second, so that is the number used in this comparison.
The Mill build benchmarks for Gatling is generally much snappier than the cold sbt benchmark,
and comparable to that Hot sbt benchmark. Mill is marginally faster in the
Parallel Clean Compile All benchmark (10s vs 14s), but more importantly does not have the same
Cold vs Hot distinction that sbt has: as Mill is always run "cold" from the command line and
keeps the process around to provide "hot" performance automatically.
For the benchmarks above, each provided number is the median wall time of three consecutive runs
on my M1 Macbook Pro. While ad-hoc, these benchmarks are enough to give you a flavor of how
Mill’s performance compares to sbt. For a fair comparison, we disabled gatling-build-plugin
in the sbt setup, which bundles the various scalafmt/scalafix/etc. linters as part of compile,
since Mill doesn’t bundle them and instead expects them to be invoked separately.
Parallel Clean Compile All
$ sbt clean; time sbt test:compile
34.28s
32.84s
34.55s

$ sbt

sbt> clean; test:compile
15s
13s
14s

$ ./mill clean; time ./mill -j 10 __.compile
10.7s
9.4s
10.4s
This benchmark measures the time taken to parallel compile all the Java and Scala code in
the Gatling code base. We configure Mill to do the same using the same number of threads
(10 on my laptop) as sbt uses. As sbt runs in parallel by default, we do not have a
comparison for sequential execution times.
Clean Compile Single-Module
> sbt clean; time sbt gatling-commons/compile
10.1
10.7
10.1

sbt> clean; gatling-common/compile
1s
1s
1s

$ ./mill clean; time ./mill gatling-common.compile
0.96s
0.95s
0.96s
This benchmark indicates the use case of clean-compiling a single module. In this case,
the gatling-commons module’s application code in `commons/, excluding the test code in
and all the downstream submodules.
Incremental Compile Single-Module
$ echo "" >> gatling-commons/src/main/scala/io/gatling/commons/util/Arrays.scala
$ time sbt gatling-commons/compile
6.6s
6.2s
6.0s

sbt> gatling-commons/compile
0s
0s
0s

$ echo "" >> gatling-commons/src/main/scala/io/gatling/commons/util/Arrays.scala
$ time ./mill gatling-commons.compile
0.49s
0.48s
0.47s
This benchmark measures the common case of making a tiny change to a single file and
re-compiling just that module. This is the common workflow that most software developers
do over and over day-in and day-out. We simulate this by appending a new line to the
file gatling-commons/src/main/scala/io/gatling/commons/util/Arrays.scala.
Both Mill and sbt are able to take advantage of the small code change and re-compile
only the single files needing re-compilation, demonstrating substantial speedups over
the Clean Compile Single-Module benchmark above. Both Hot sbt and "Mill" finish in
a fraction of a second, while Cold sbt has substantial overhead.
No-Op Compile Single-Module
$ time sbt gatling-commons/compile
4.2s
4.2s
4.2s

sbt> gatling-commons/compile
0s
0s
0s

$ time ./mill gatling-commons.compile
0.39s
0.41s
0.40s
This benchmark is meant to measure the pure overhead of running the build tool: given a single module that did not change, the build tool should need to do nothing in response, and so any time taken is pure overhead.
Again, we see both Hot sbt and "Mill" finish in a fraction of a second, with the Mill numbers
showing a ~0.4s overhead to run Mill even when there is no work to do, and the Cold sbt has
in comparison substantial >4s overhead.
IDE Support
One area that Mill does significantly better than sbt is in the IDE support.
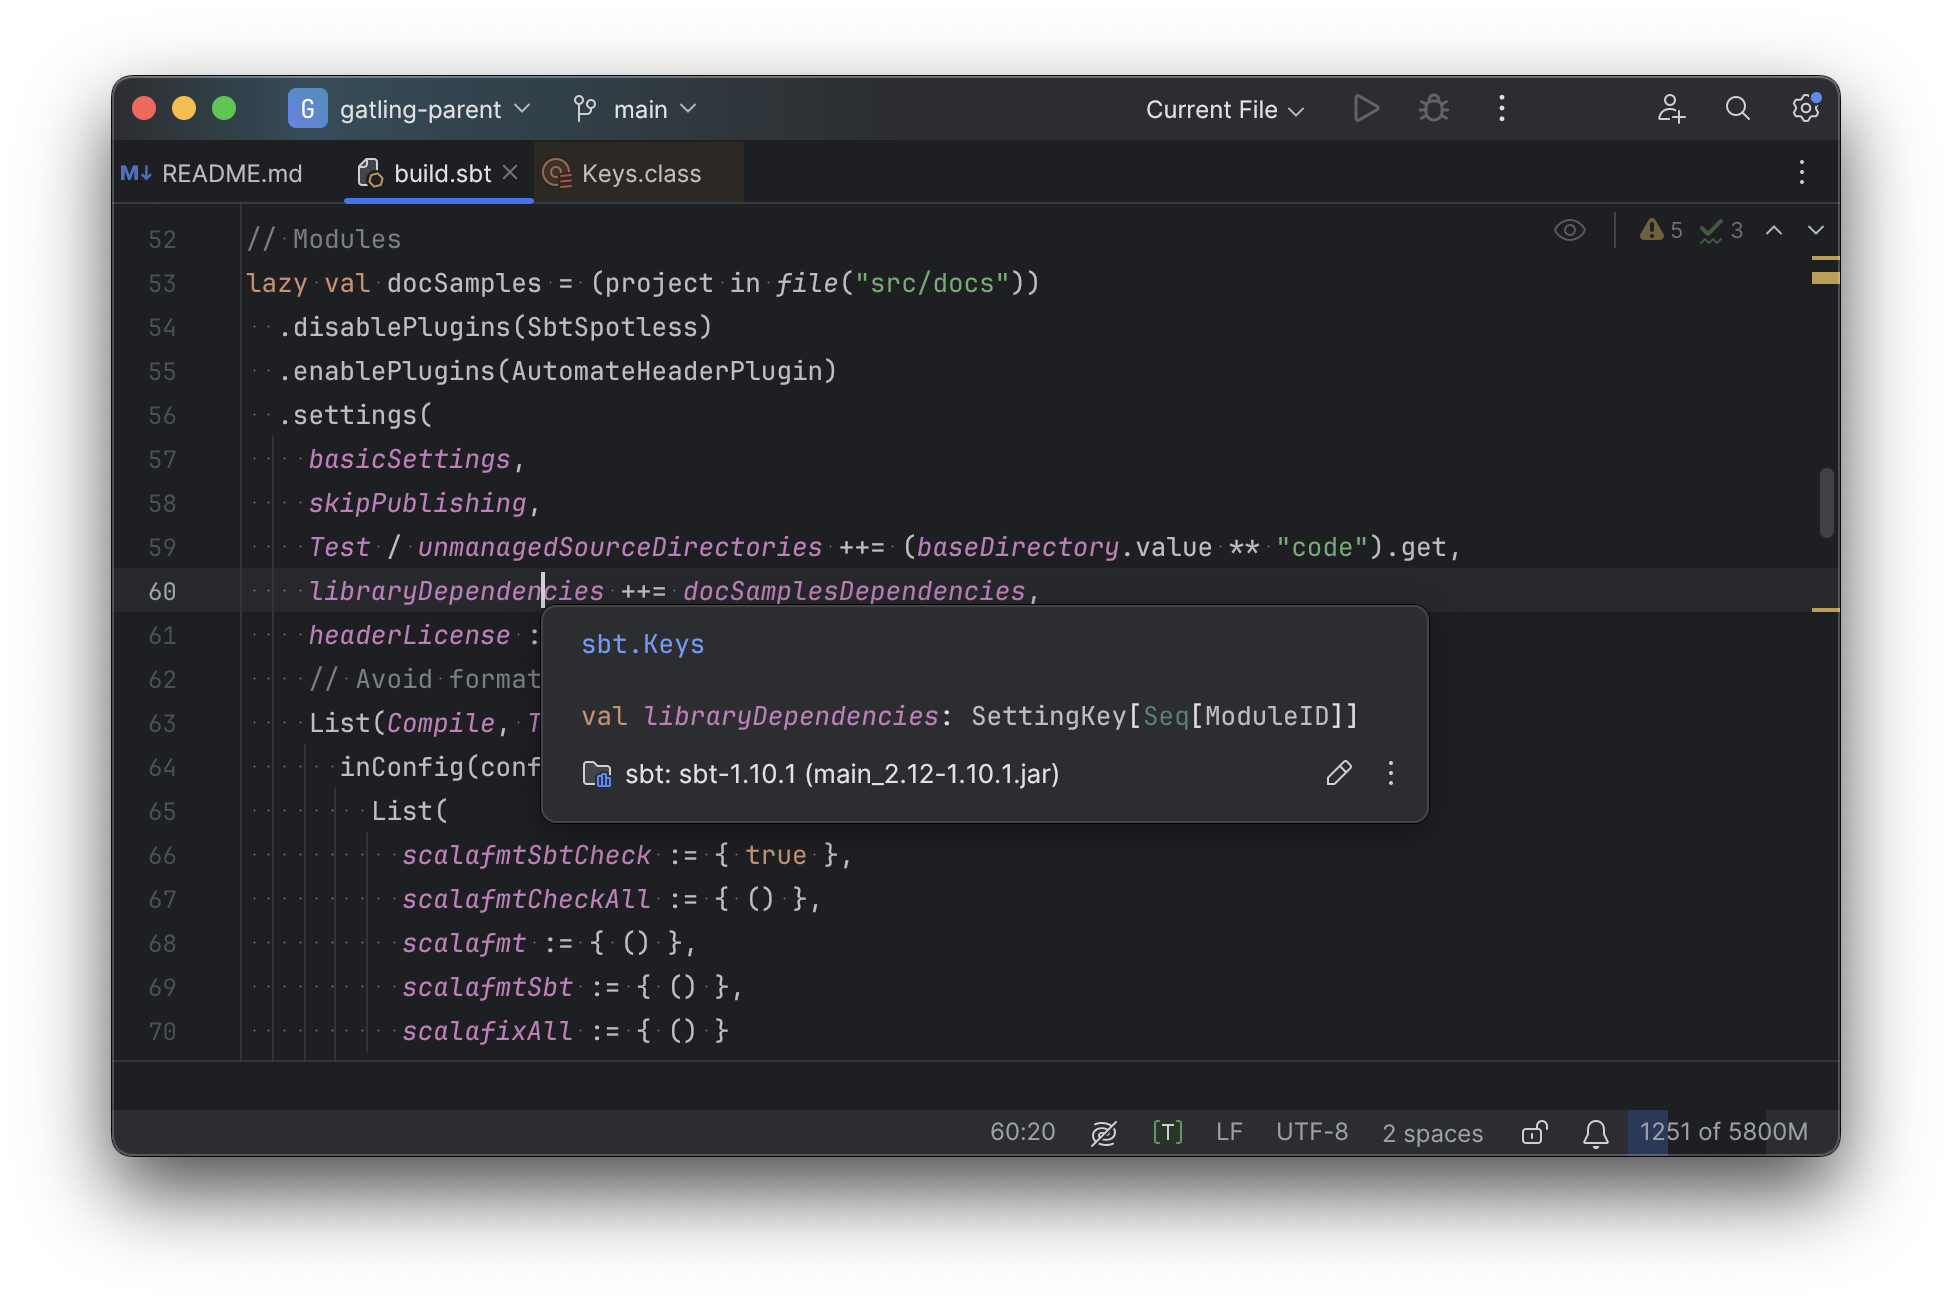
For example, although IDEs like IntelliJ are nominally able to parse and analyze your sbt files, the assistance they can provide is often not very useful.
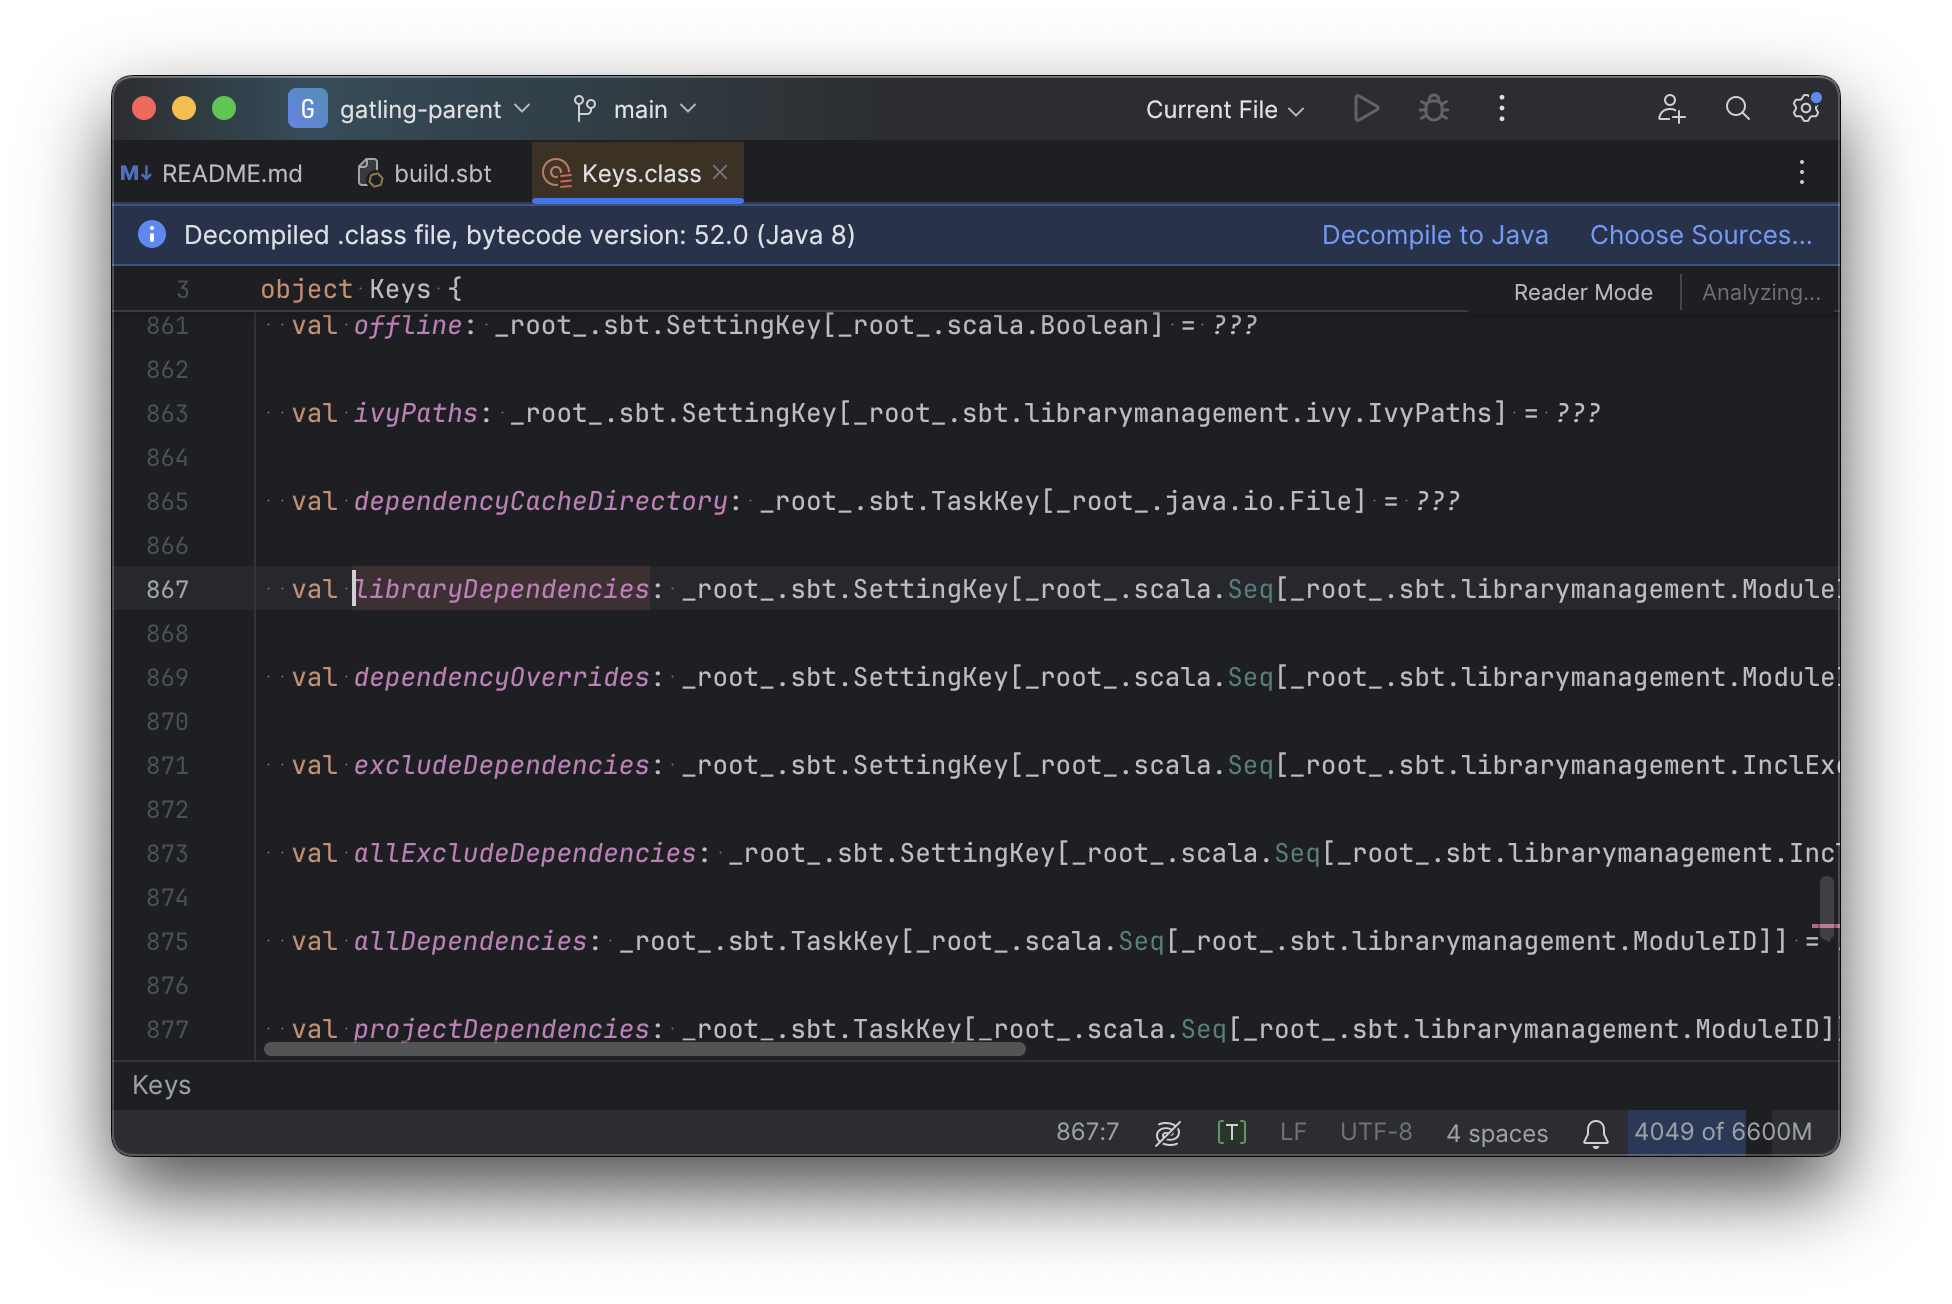
For example, consider the inspection and jump-to-definition experience of looking into an sbt Task:
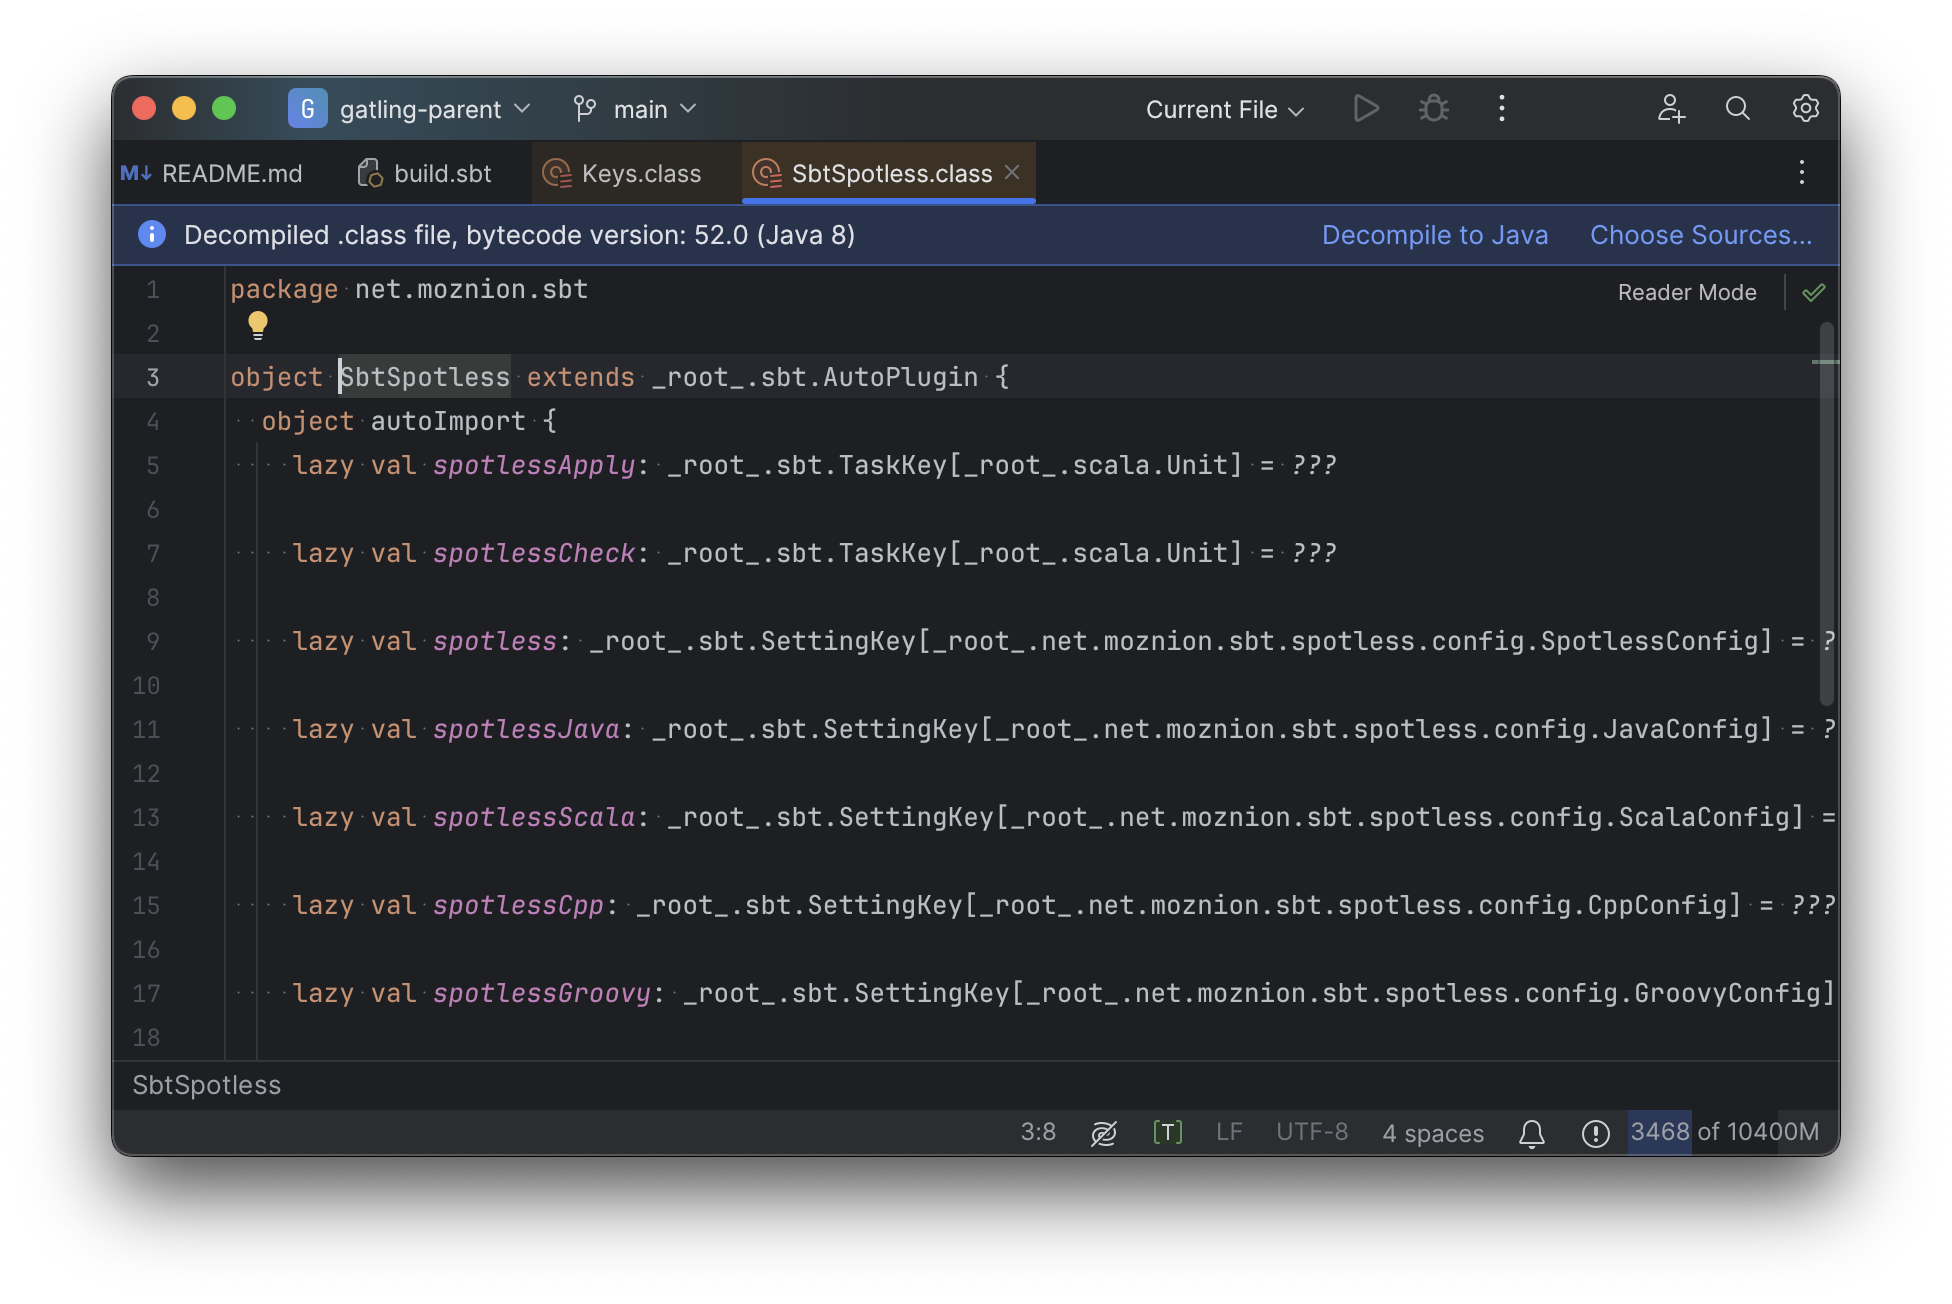
Or an sbt plugin:
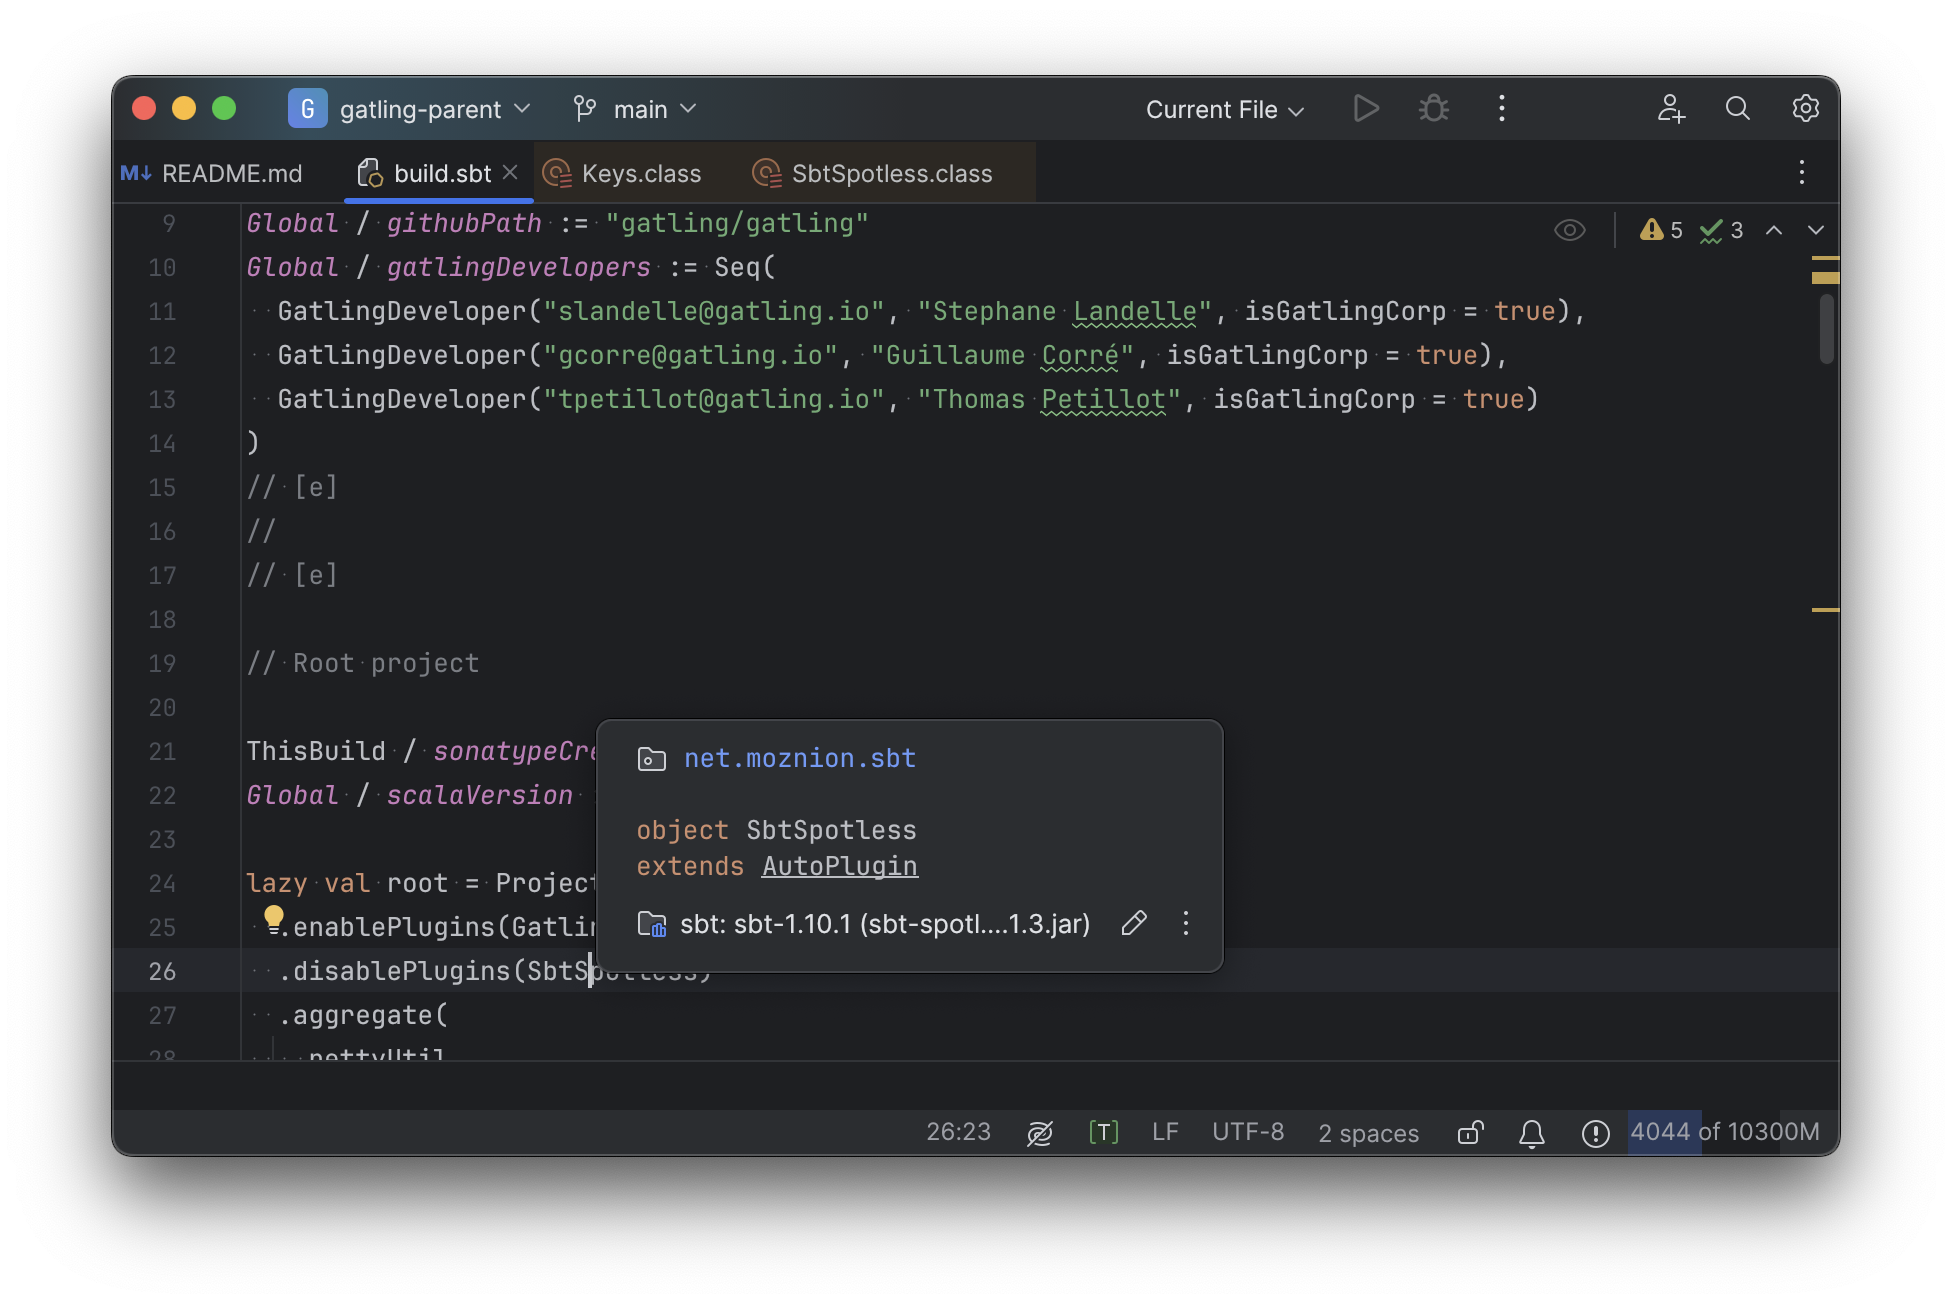
In general, although your IDE can make sure the name of the task exists, and the type is correct, it
is unable to pull up any further information about the task: its documentation, its implementation,
usages, any upstream overridden implementations, etc..
Some of this is the limitations of the IDE, but some of it is fundamental: because sbt makes the developer define the val myTask separate from the assignment of myTask := something, jumping to the definition of myTask tells you nothing at all: what it does, where it is assigned, etc.
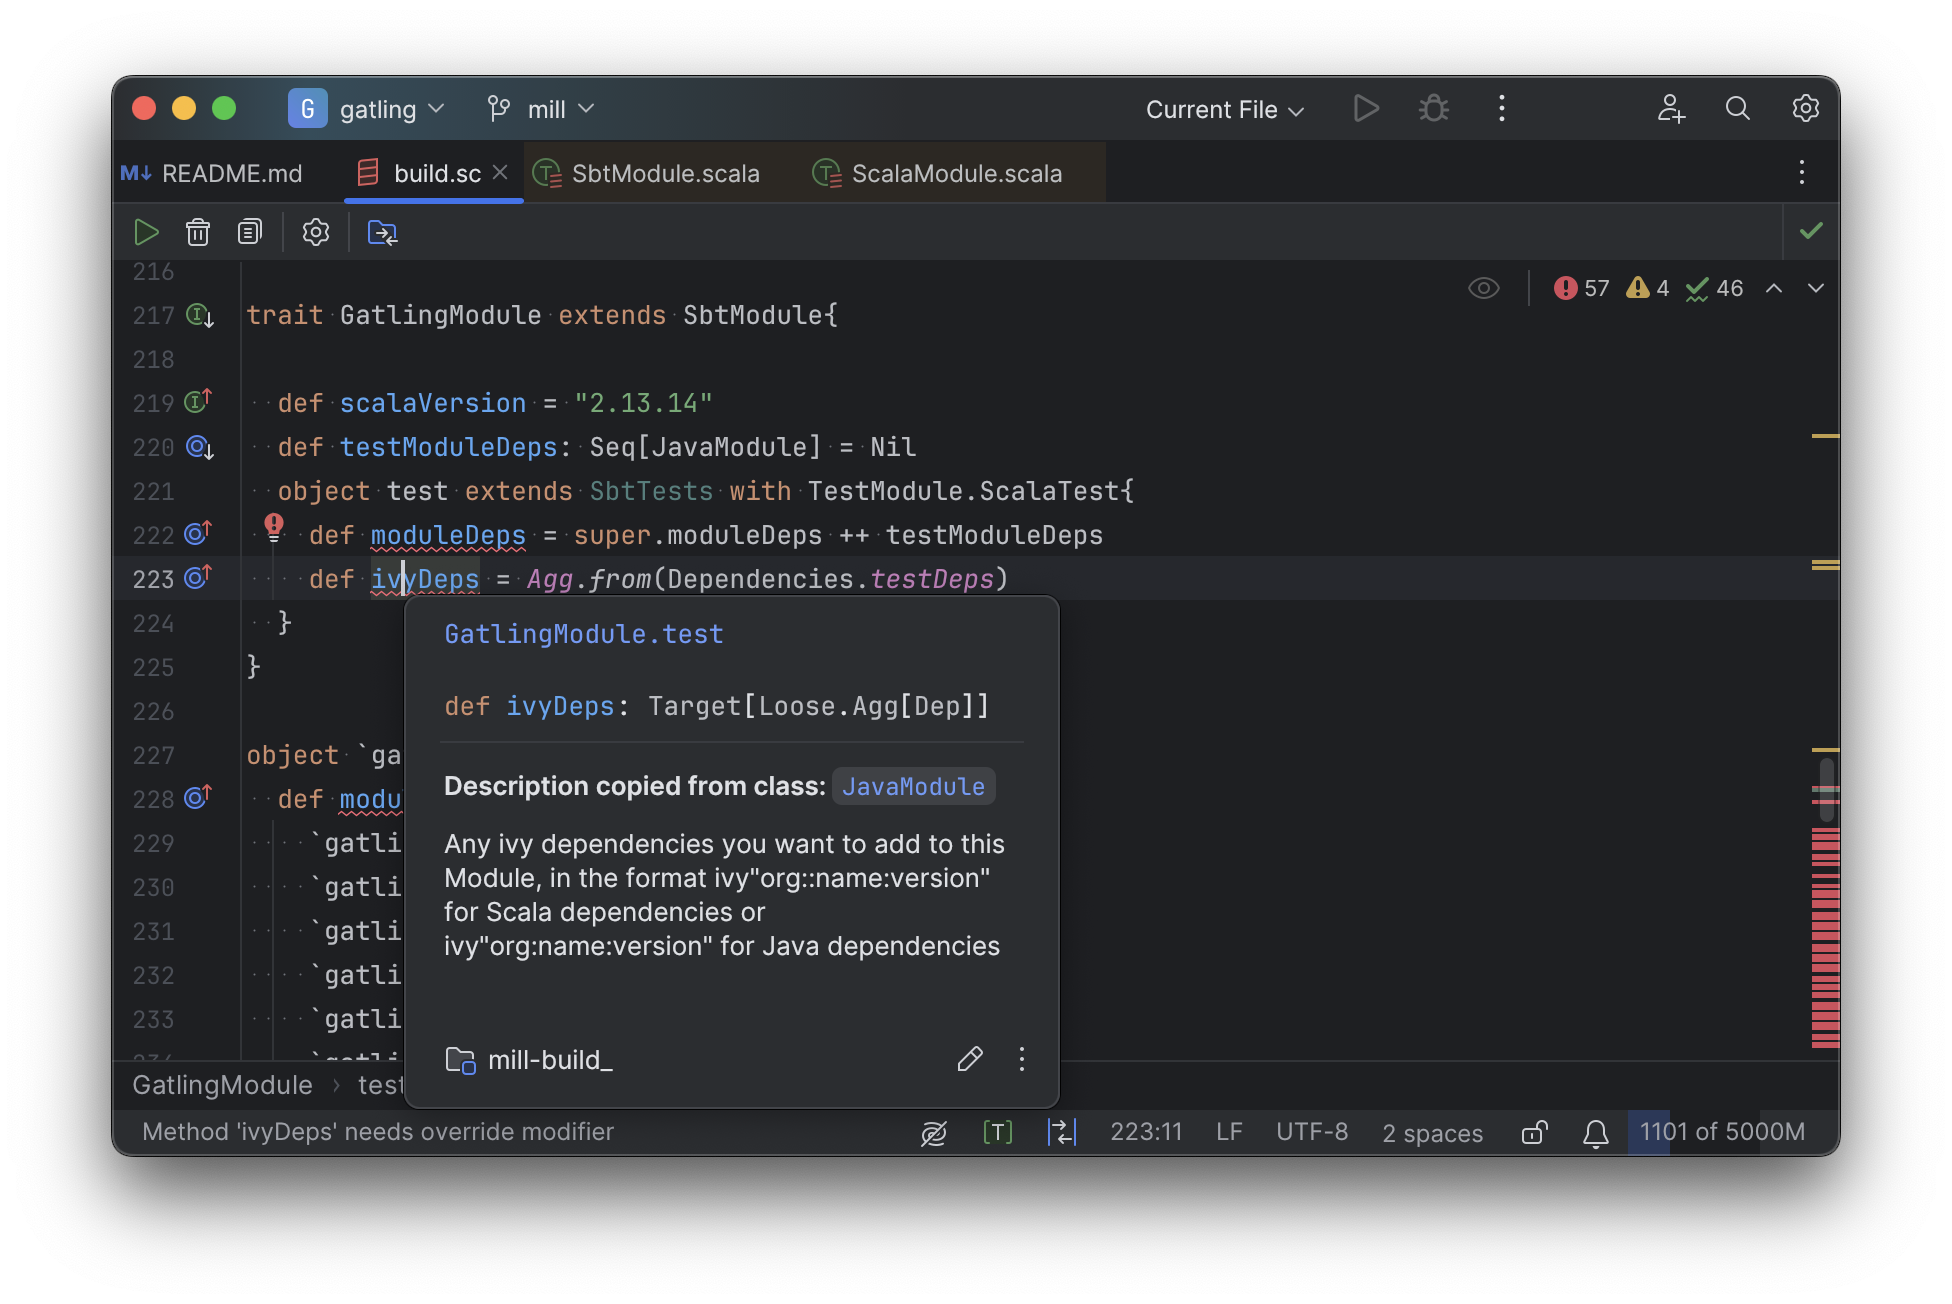
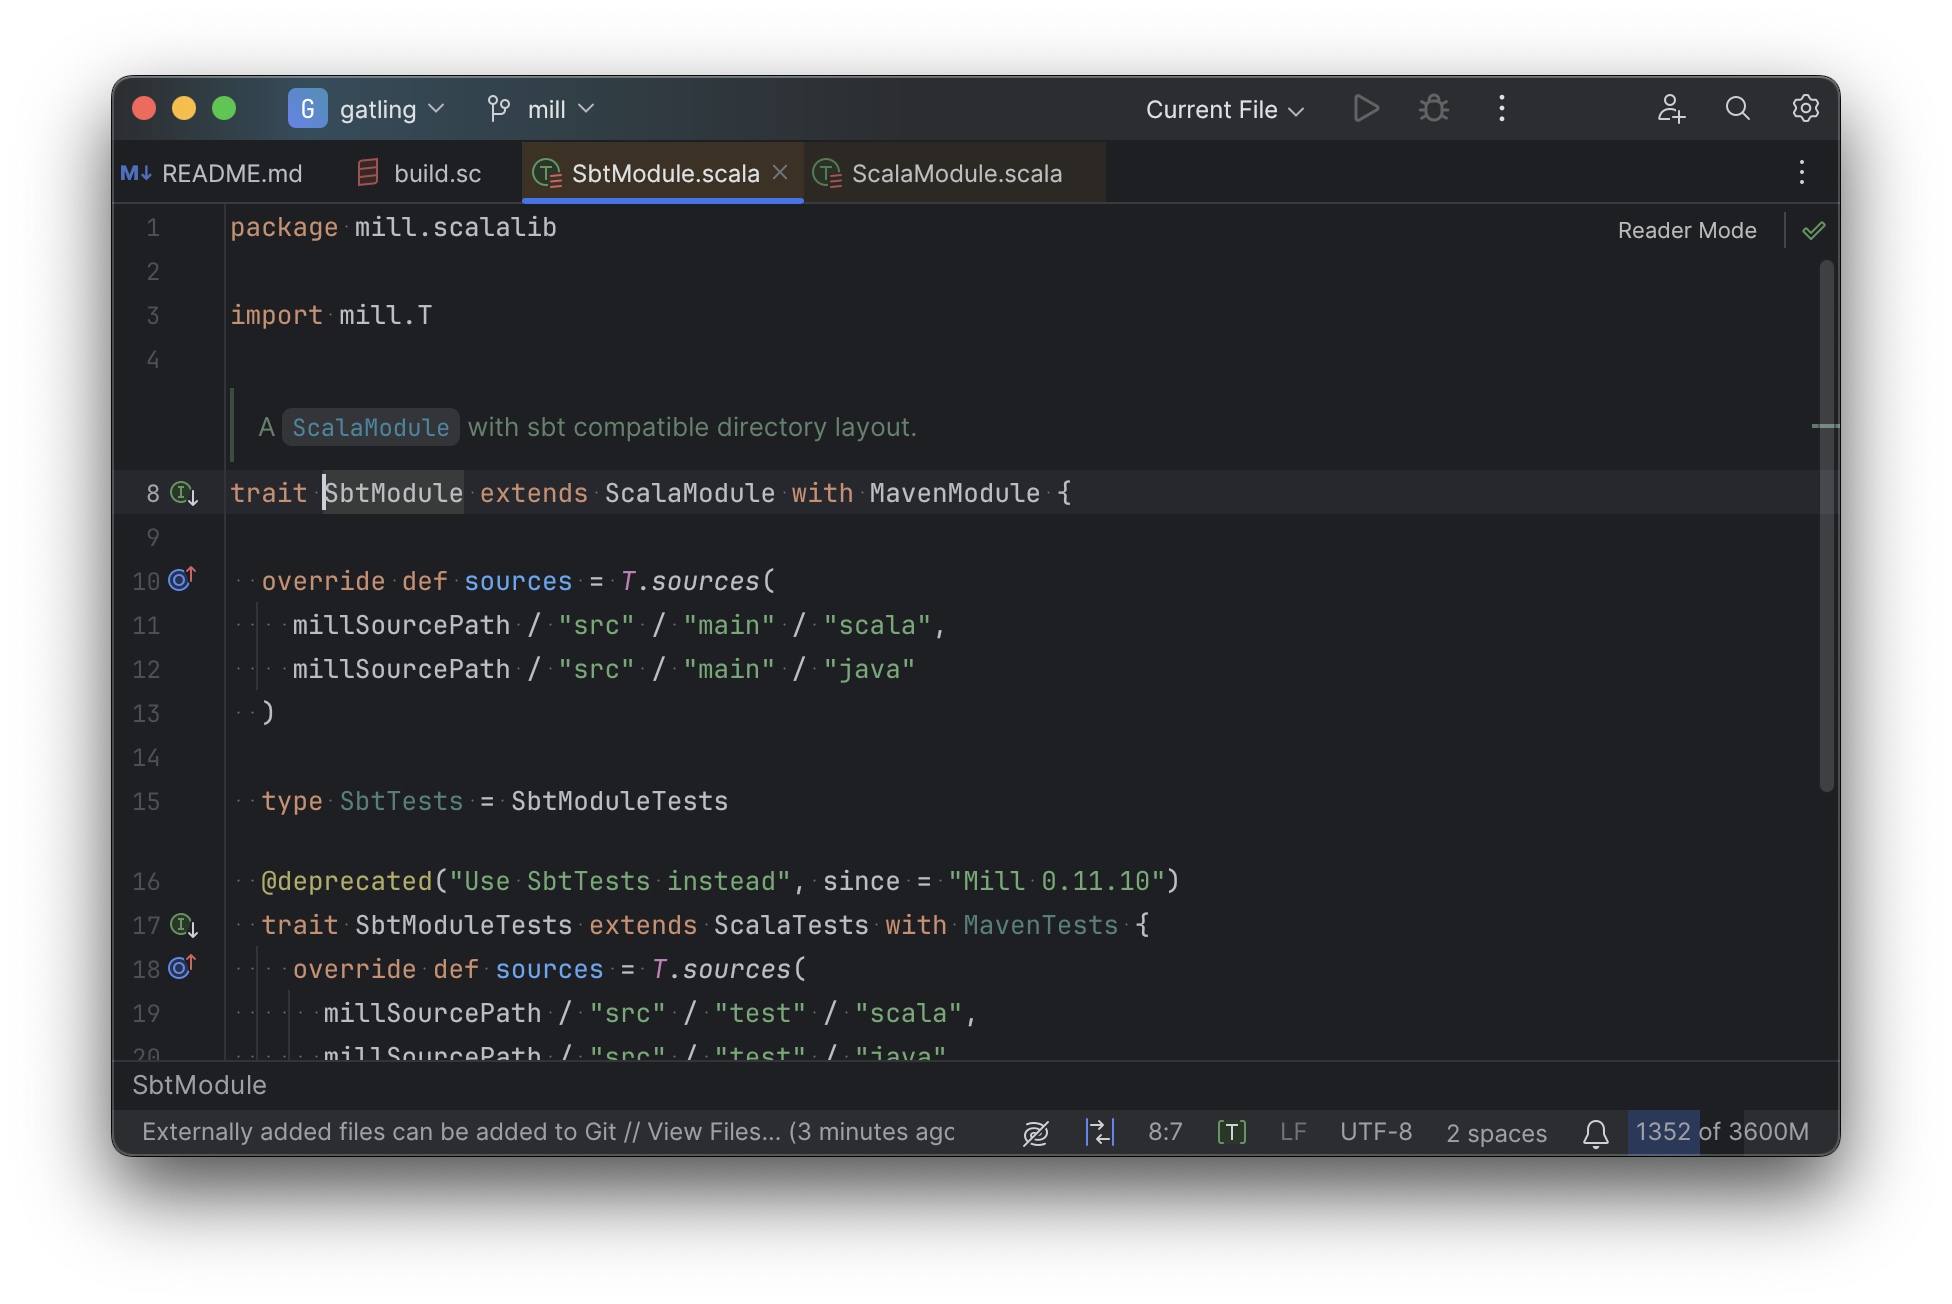
In comparison, for Mill, IDEs like Intellij are able to provide much more intelligence. e.g. when inspecting a task, it is able to pull up the documentation comment:
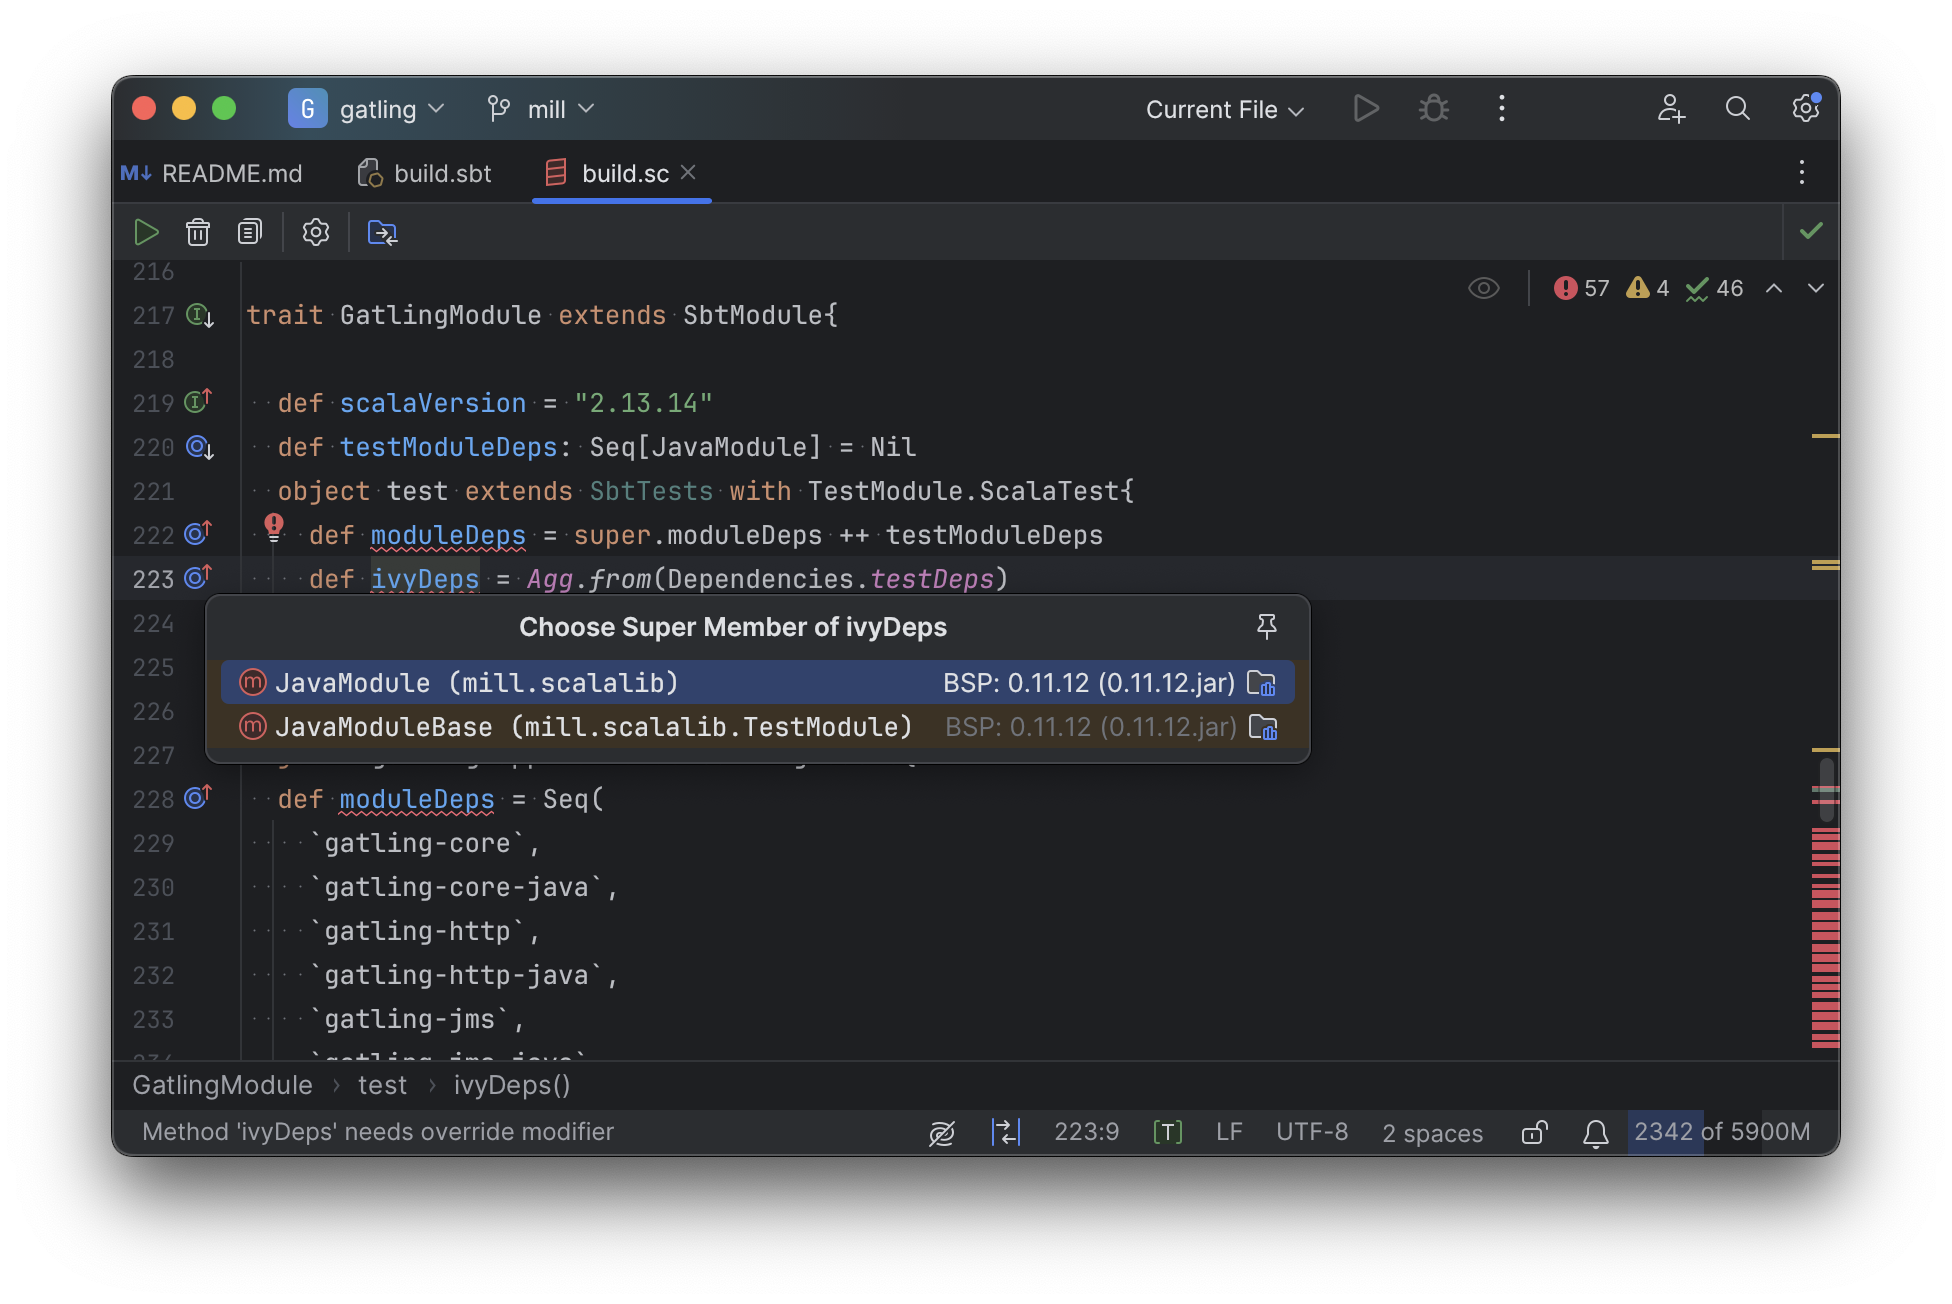
It is able to pull up any overridden implementations of task, directly in the editor:
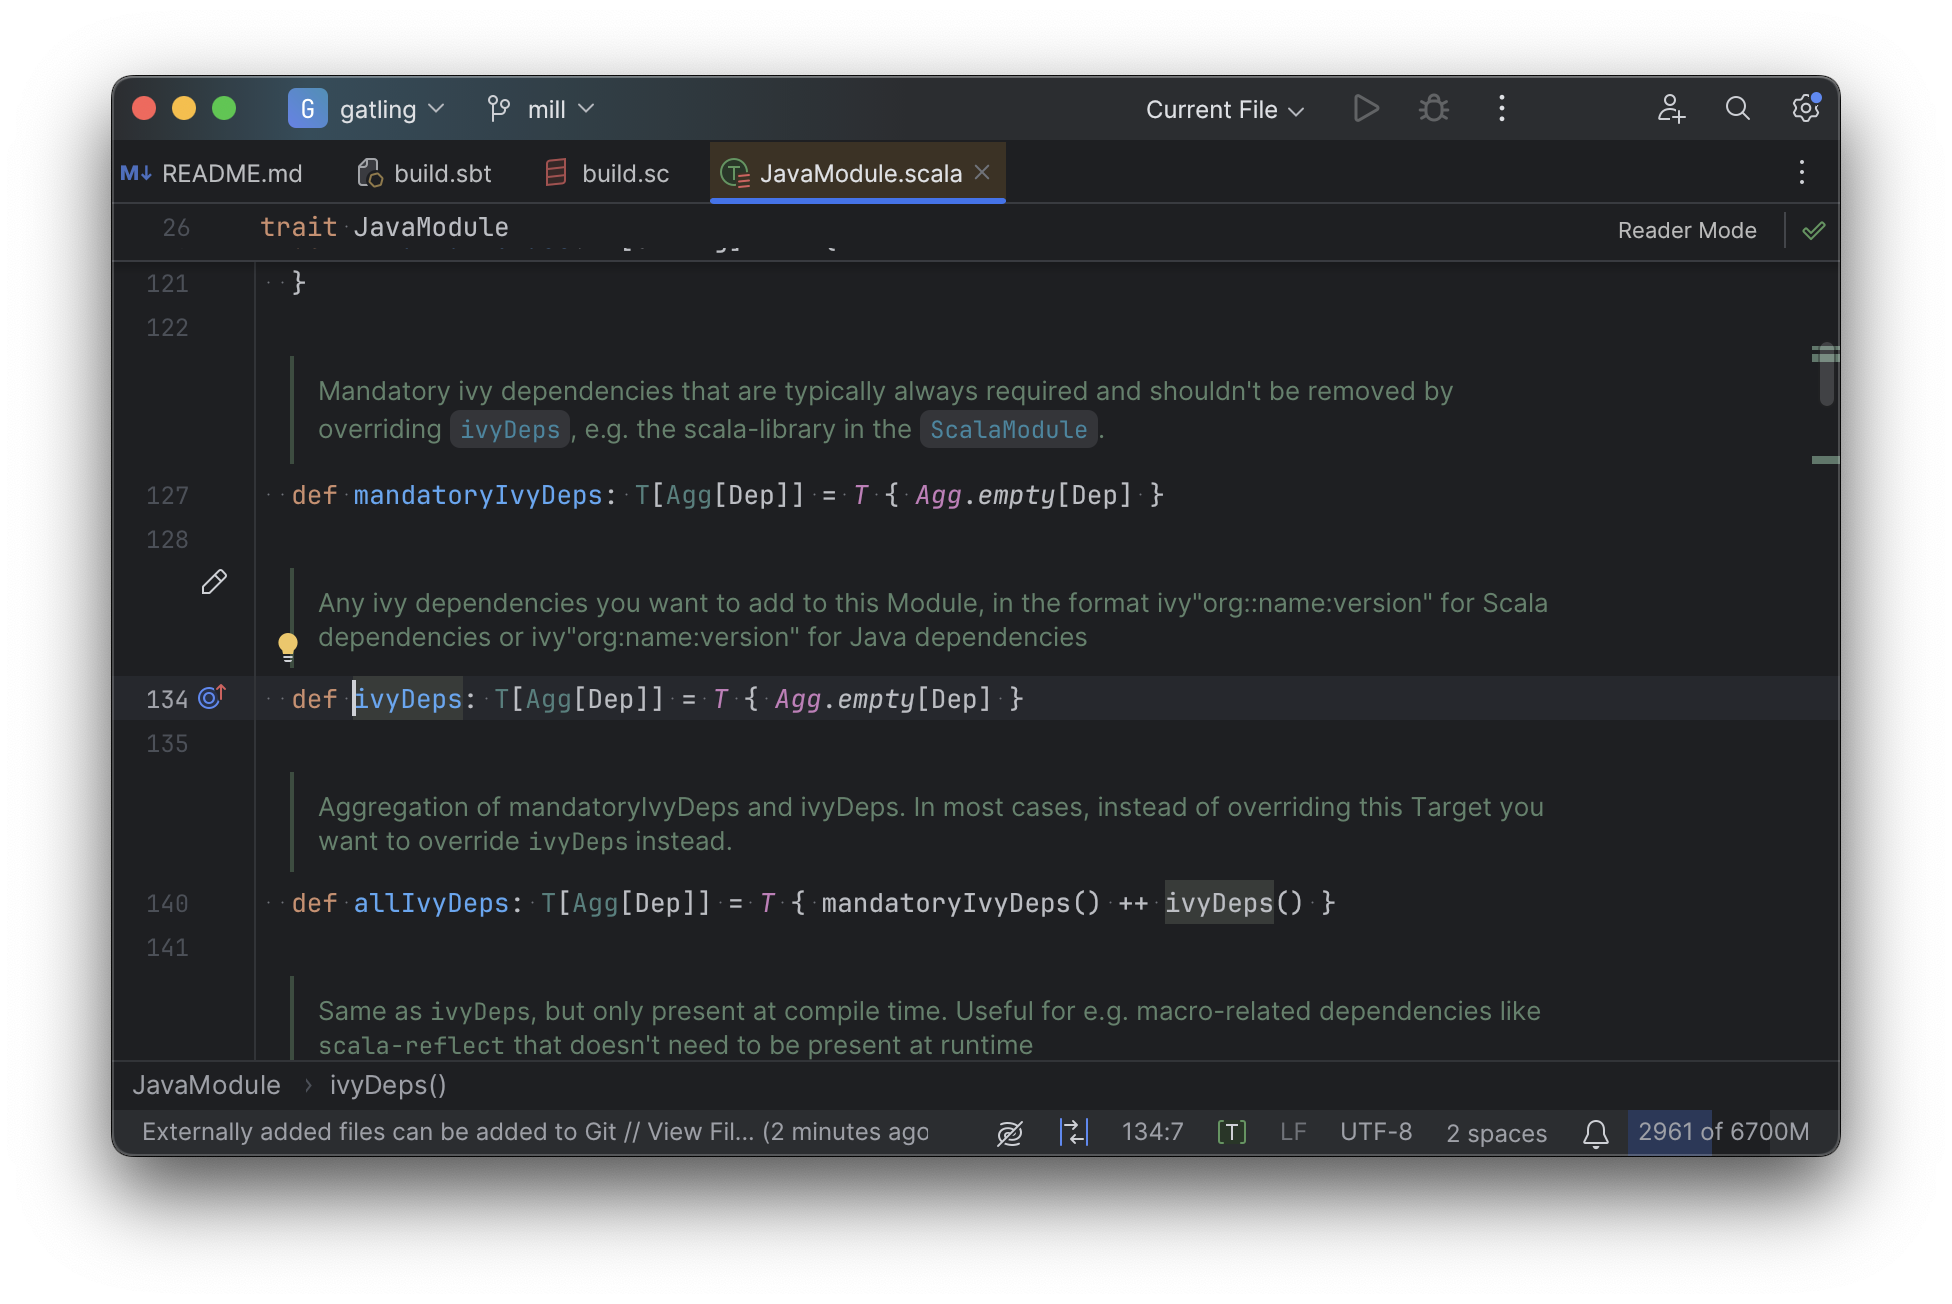
And you can easily navigate to the overridden implementations to see where they are defined and what you are overriding:
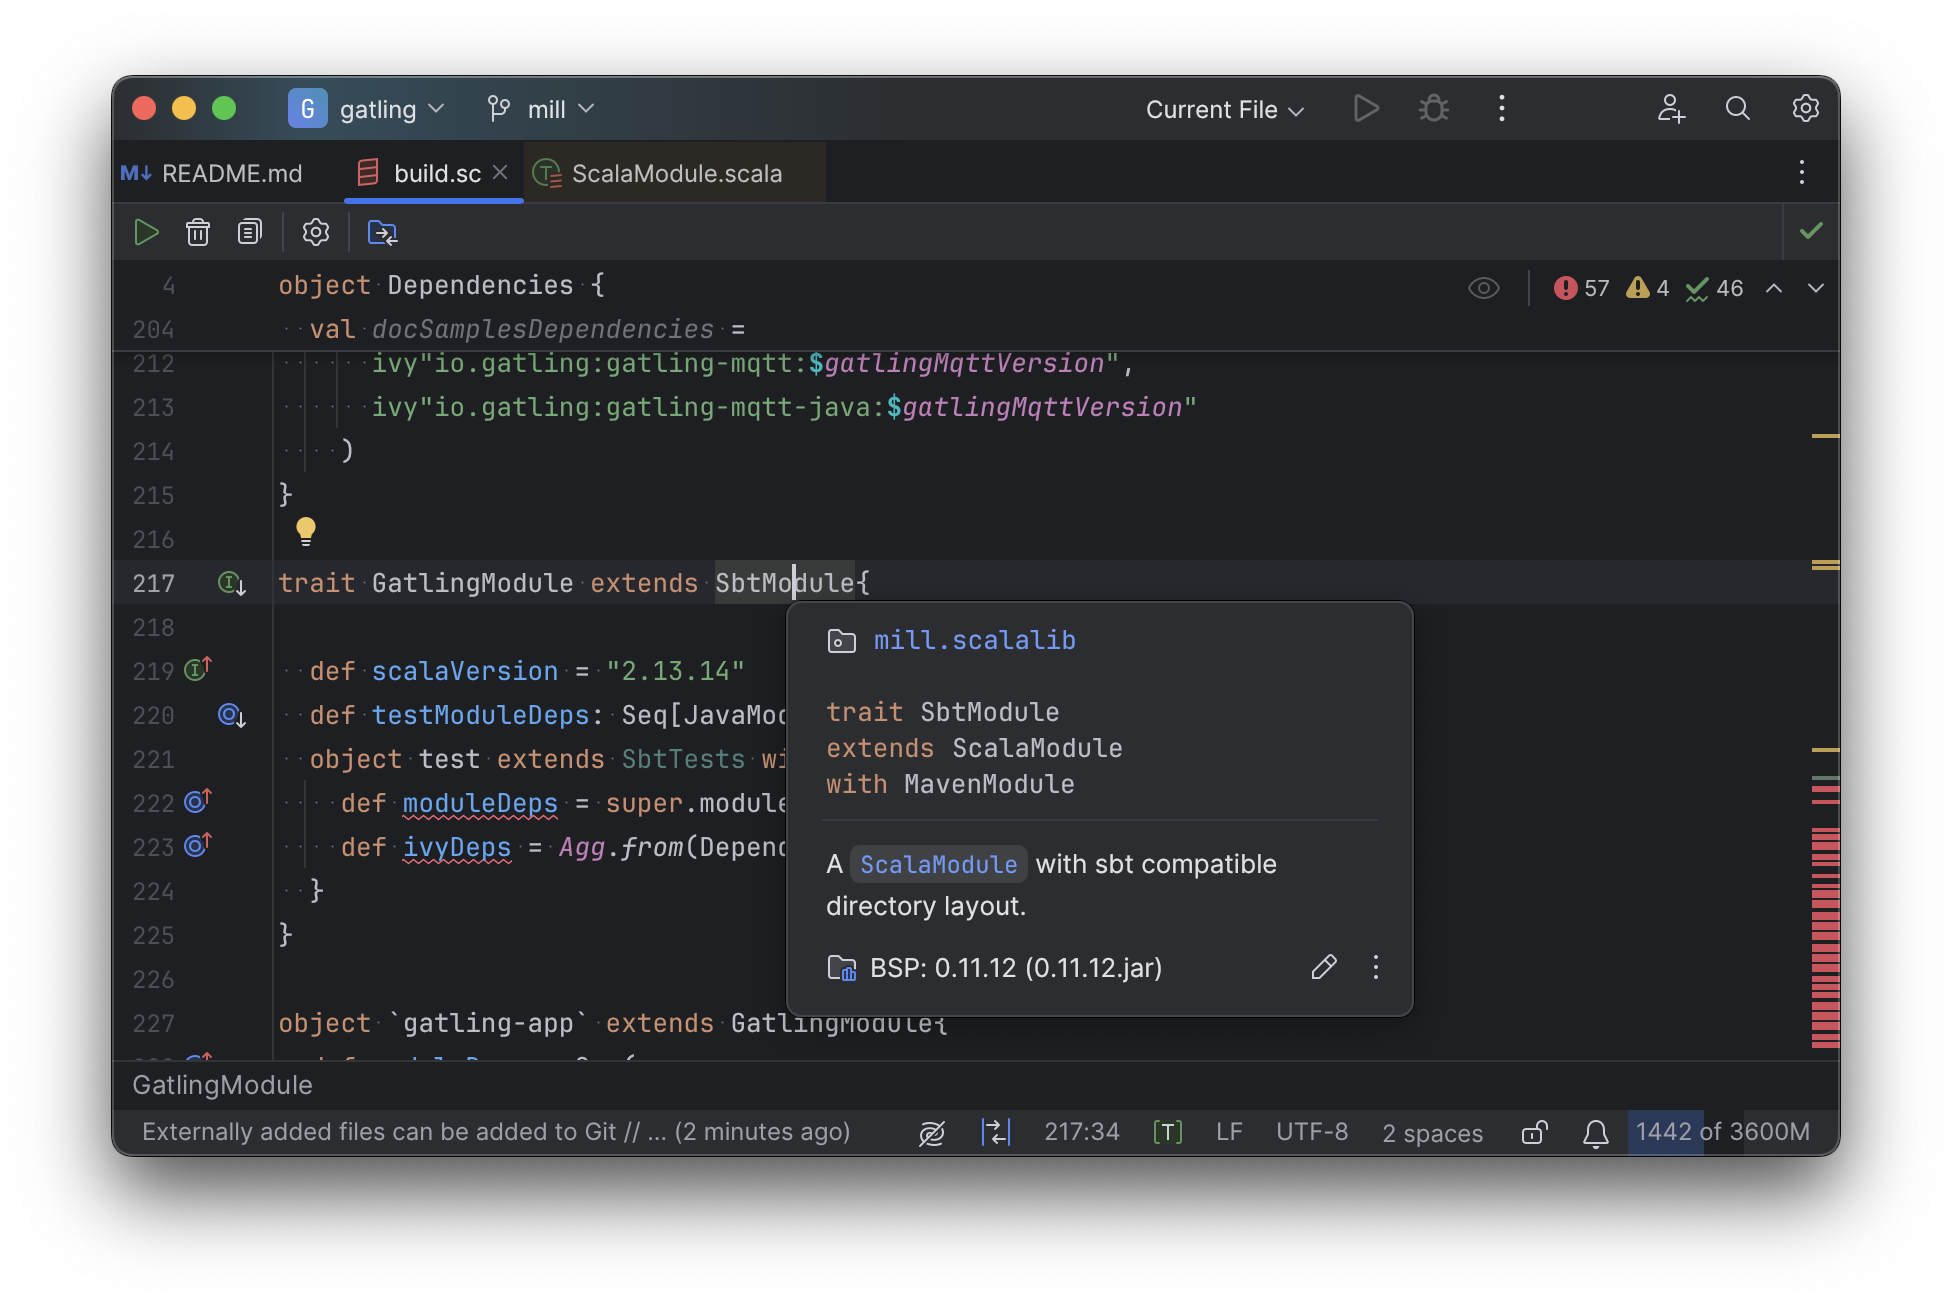
Mill’s equivalent of sbt plugins are just Scala traits, and again you can easily pull up their
documentation in-line in the editor or jump to their full implementation:
In general, navigating around your build in Mill is much more straightforward than
navigating around your build in sbt.
All your normal IDE functionality works perfectly:
jump-to-definition, find-usages, peek-at-documentation, and so on.
Although the Mill and sbt builds end up doing the same basic things - compiling Scala, running tests,
zipping up jars - Mill helps de-mystify things considerably so you are never blocked
wondering what your build tool is doing.
Debugging Tooling
Another area that Mill does better than sbt is providing builtin tools for you to understand
what your build is doing.
For example, the Gatling project build discussed has 21 submodules
and associated test suites, but how do these different modules depend on each other?
With Mill, you can run ./mill visualize __.compile, and it will show you how the
compile task of each module depends on the others:

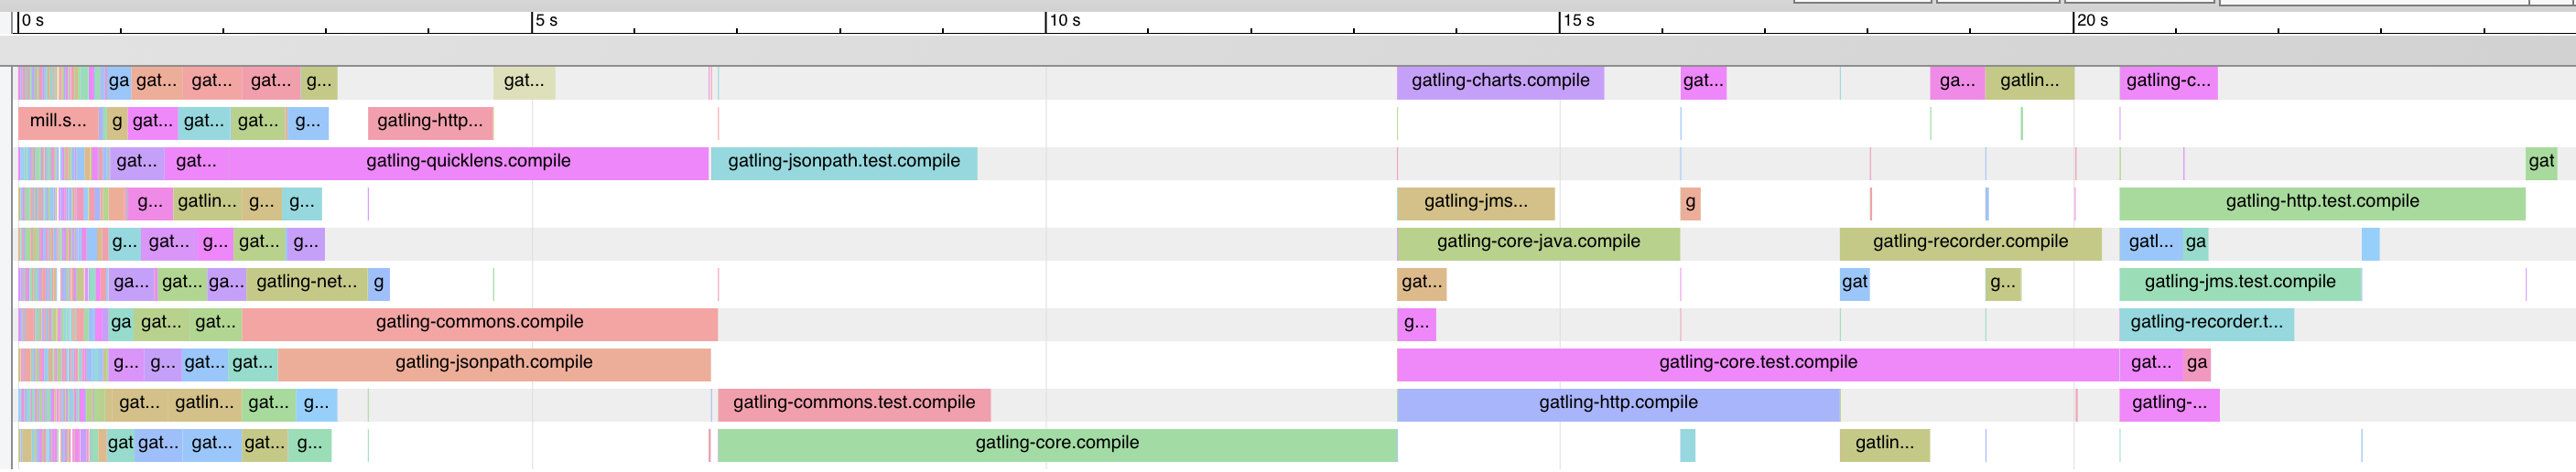
Apart from the static dependency graph, another thing of interest may be the performance
profile and timeline: where the time is spent when you actually compile everything.
With Mill, when you run a compilation using ./mill -j 10 __.compile, you automatically get a
out/mill-chrome-profile.json file that you can load into your chrome://tracing page and
visualize where your build is spending time and where the performance bottlenecks are:
If you want to inspect the tree of third-party dependencies used by any module, the
built in mvnDepsTree command lets you do that easily:
$ ./mill gatling-app.mvnDepsTree
[137/137] gatling-app.mvnDepsTree
├─ org.scala-lang:scala-library:2.13.14
├─ io.gatling:gatling-shared-model_2.13:0.0.6
│  ├─ io.gatling:gatling-shared-util_2.13:0.0.8
│  │  ├─ org.scala-lang:scala-library:2.13.14
│  │  └─ org.scala-lang.modules:scala-collection-compat_2.13:2.11.0
│  │     └─ org.scala-lang:scala-library:2.13.14
│  ├─ io.suzaku:boopickle_2.13:1.3.3
│  │  └─ org.scala-lang:scala-library:2.13.14
│  └─ org.scala-lang:scala-library:2.13.14
├─ io.gatling:gatling-shared-cli:0.0.3
│  └─ com.github.spotbugs:spotbugs-annotations:4.8.4 -> 4.8.6
│     └─ com.google.code.findbugs:jsr305:3.0.2
├─ org.simpleflatmapper:lightning-csv:8.2.3
│  └─ org.simpleflatmapper:sfm-util:8.2.3
├─ com.github.ben-manes.caffeine:caffeine:3.1.8
│  ├─ com.google.errorprone:error_prone_annotations:2.21.1
│  └─ org.checkerframework:checker-qual:3.37.0
...
None of these tools are rocket science, but Mill provides all of them out of the box in a convenient package for you to use. Whether you want a visual graph layout, a parallel performance profile, or a third-party dependency tree of your project, Mill makes it easy and convenient without needing to fiddle with custom configuration or third party plugins. This helps make it easy for you to explore, understand, and take ownership of the build tool.
Conclusion
Both the Mill and sbt builds we discussed in this case study do the same thing: they
compile Java and Scala code and run tests.
If set up and used properly, sbt builds are performant and do what needs to be done.
Where Mill has an advantage over sbt is in its simplicity and understandability.
You do not need to worry about using it "the wrong way" and ending up with workflows running
slower than necessary.
You can explore your build using your IDE like you would any other
project, tracing task dependencies using the same jump-to-definition you use to trace
method calls in your application code.
Mill provides builtin tools to help you navigate, visualize, and understand your build, turning a normally opaque "build config" into something that’s transparent and easily understandable.